Hands-on: a three-axis acceleration chart
Module 3 — Sensor Visualization on HMI · Slides: slides.md · Module overview · Course page
Complete the practice file so the screen shows a live three-axis acceleration chart, a min/max table and separate start and stop buttons, then prove with the real loop period on screen that everything runs at the rate you set.
Objectives
Section titled “Objectives”By the end of this lesson you will be able to:
- Fill the six blanks in s07_accel_chart.py in three stages until the screen shows three separately coloured lines for X, Y and Z, with Z near 9–10 and X and Y near zero when the board lies still
- Build start and stop buttons around a running flag, keeping ui.poll() outside the if running block, so that after Stop the chart does not move when shaken, the lamp dims, and Start resumes the chart, for at least three toggles
- Show the real loop period measured with time.ticks_diff() on screen, and explain why a loop that only calls set_next() crawls and how sending .text() at least once per loop fixes it
- Match at least three silent symptoms from the trap table (such as a missing Z row, a line stuck at the top edge, or a strange slow wave when shaking fast) to their cause and fix
Before you start
Section titled “Before you start”Make sure you are solid on ui.Chart’s multiple series, a flag-based stop button, and measuring the loop period from lesson 3.5. Keep the BENTO Playground card open on the board’s screen, and set the board somewhere it can move freely. This file deliberately has no sensors.init(), and on a freshly reset Eva Kit, the first sensor read can sit still for up to 16 seconds — that is waiting, not hanging.
- Equipment: an Eva Kit or TESAIoT Dev Kit board with the BENTO MicroPython firmware installed, or the BENTO Emulator in BENTO IDE
- Before this: Lesson 3.5 — ui.Chart: multi-series plots and the real loop period
Concepts
Section titled “Concepts”This lesson is the checkpoint for lessons 3.4–3.6: a live three-axis acceleration chart, an extreme-value summary table, and separate start and stop buttons.
The chart and the table are not repeating each other — the chart tells you “the shape over time” but forgets points older than 50 slots, while the table
remembers the minimum and maximum in lo and hi, which live outside the loop because they are the program’s memory. The table’s cells start as “-”,
not empty, because an empty cell could mean either “no value yet” or “the screen is broken”. The chart line moves five times a second, but the numbers in the
table are rewritten once per second, because the eye can read a shape instantly, but nobody can read a number running five times a second.
A safe “stop” stops feeding data, not the loop. running is just a flag: set_next() sits under if running:,
but ui.poll() always sits outside. Move poll inside too, and the stop button kills its own way back — the screen would look hung,
even though the program is still running every line. Start and stop are separate buttons, because one button that toggles cannot tell you which
state you are in right now. What reports state is a lamp and the label beside it, and led_rec.value(0) “dims” the lamp, it does not make it vanish.
The thing nobody can guess is the pulse of the cross-core channel. The screen side has two timer speeds, fast at 5 ms and normal at 200 ms, and stays in fast mode
for another 500 ms every time it gets a command that writes text, or moves, shrinks, or recolours something — but set_next()
and .value() do not wake this mode. A loop with only a chart in it therefore falls back to slow mode, where CM55 can only drain 80 commands a second,
about 40 times slower than a loop that also has a label. The fix is to send lbl_rec.text(rec_msg) every round — even the same text is fine,
since the firmware does not redraw it if the text has not changed, so all we pay for is the value sent across the cores.
Three numbers in this file each have a reason behind them: set_next() only takes integers; sending a float directly raises TypeError, and
int() is what discards the decimal. The Y axis is set to -20 to 20, because gravity sits at 9.81, leaving room for about the same amount of swing again.
PERIOD_MS = 200 means 5 samples a second, enough to see a hand waving, but shaking faster than 2.5 Hz makes the chart show
a slow wave that never really existed — that is aliasing, not a bug.
The solution is ordered into five moves to cut through the pile of bugs one layer at a time: prepare the sensor and screen (a broken foundation makes everything after it meaningless), build the chart (see the empty frame appear first), buttons and flag (the emergency exit comes before the data), feed real data (if it goes wrong now, it went wrong at the reading), and measure the loop period (the diagnostic tool for all four moves above). The whole screen uses only 8 widgets, and twelve of the fifteen items in the trap table show no error message at all — only “the chart looks strange”, which we must learn to read as a symptom.
Worked example
Section titled “Worked example”Open these in order, about 20 minutes total.
- 03_aliasing_nyquist.py from lesson 3.4 (about 8 minutes) — before touching your own
PERIOD_MSnumber, predict whether sampling too slowly will make a line simply vanish or show something else instead, then run it and see exactly where the real wave and the wave the device thinks it sees separate - 01_imu_vibration_monitor.py (about 12 minutes) — run it and watch the two threshold lines and the stop-chart button, then look at how it names each series’ variable and why it multiplies the value before feeding the chart. This file’s loop structure, threshold lines and stop button can be copied straight into your team’s own file
If pressing start or stop does nothing to the screen at all, open 02_event_types.py from lesson 2.5, because a Button sends
clicked while a Switch sends toggled, and catching the wrong type fails silently. 02_fft64_two_tones.py and ex16_spectrum_analyzer.py
are optional further reading, outside this lesson’s passing criteria.
| File | What this file teaches |
|---|---|
| examples/01_imu_vibration_monitor.py | Watching a machine’s vibration |
The slides for this lesson also refer to files that live in other lessons:
- m02-ui-to-hardware/l05-event-loop/examples/02_event_types.py — what an event looks like, and who sends what
- m03-sensor-hmi/l04-sampling/examples/03_aliasing_nyquist.py — sampling too slowly, and getting a frequency that never really existed
- m03-sensor-hmi/l05-realtime-chart/examples/02_fft64_two_tones.py — a hand-written 64-point radix-2 FFT, from scratch
- shared/lvgl_ports/sec3_sensor_viz/eva/ex16_spectrum_analyzer.py
Screens from the BENTO Emulator for this lesson’s examples (click a file name to open the code)
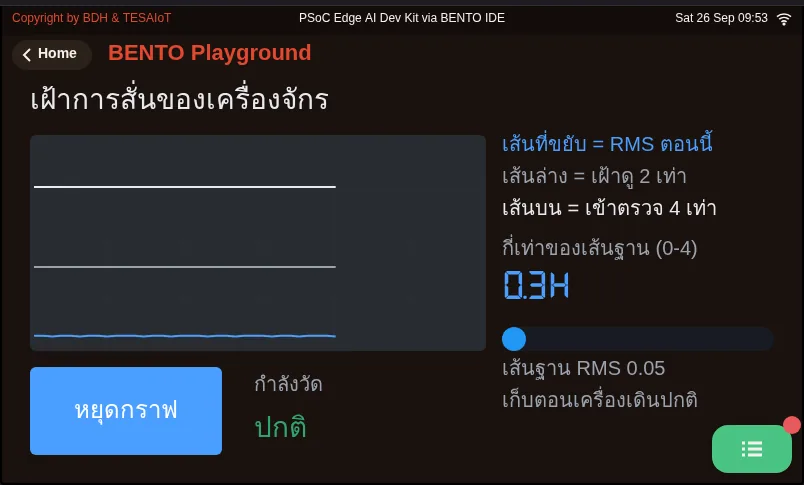
01_imu_vibration_monitor.py Watching a machine's vibrationPractice
Section titled “Practice”The practice file has 6 blanks. The screen has already been written for you in full; our job is making values flow into it. Fill it in in three stages, sending to the board after each. The order matters, because the code below refers to variables created by the blank above it.
- Stage 1, blanks 1–2:
s_az = chart.add_series(COL_AZ)thenchart.set_next(0, int(ax)). You should see all three lines running. The X axis is series 0, which already comes with the Chart — neveradd_seriesfor it, or you will end up with four lines - Stage 2, blank 3:
dt = time.ticks_diff(now, last_ms). You should see the on-screen loop-period number change in real time - Stage 3, blanks 4–6:
running = True·running = False·time.sleep_ms(PERIOD_MS), then test toggling the buttons back and forth
Between stages 1 and 2, the loop has no sleep_ms yet (that is blank 6). If the chart stutters or drops points intermittently, check the
“loop too fast, commands overflow the queue” row in the trap table, and notice how the loop-period number changes after filling in blank 6.
| Practice file | Topic |
|---|---|
| practice/s07_accel_chart.py | A live three-axis acceleration chart + a three-axis summary table (fill-in version) |
Solution
Section titled “Solution”Open the solution after trying on your own at least once, and read how to use the solutions first.
| Solution | Goes with |
|---|---|
| solution/s07_accel_chart.py | practice/s07_accel_chart.py |
Check your understanding
Section titled “Check your understanding”The same questions are in quiz.yaml for automatic marking.
-
A chart is created with ui.Chart(…, color=COL_AX), then add_series is called twice for Y and Z. How should you feed the X axis’s value? (choose one · objective 1)
- A) chart.set_next(0, int(ax))
- B) s_ax = chart.add_series(COL_AX), then call chart.set_next(s_ax, int(ax))
- C) chart.set_next(0, ax), because the chart accepts floats
- D) chart.set_next(s_ay, int(ax))
Solution
A — The first line is series 0, which comes with the Chart itself (coloured from color=); it never needs add_series. Adding one more would give four lines, and set_next() only takes integers — sending a float directly raises TypeError.
-
Which statements about the stop button in the solution file are correct? Choose every correct one. (choose all that apply · objective 2)
- A) ui.poll() is called every round, even when running is False
- B) led_rec.value(0) dims the lamp; it does not vanish from the screen
- C) Pressing stop ends the while loop with break
- D) time.sleep_ms(PERIOD_MS) still delays by the same amount when stopped
- E) The extreme values in the table are cleared when stop is pressed
Solution
A, B, D — Stop is a flag, not stopping the loop. poll must sit outside if running, or the start button could never be pressed again. The loop still delays the same amount, so as not to flood CM55 with poll commands. The extreme values are cleared when start begins a new round, not when stopped.
-
Your loop sets sleep_ms(200), and the loop has only three set_next() lines and led.value(), but the chart crawls and stutters. What should you do? (choose one · objective 3)
- A) Send .text() to a Label at least once per round — the same text is fine
- B) Lower sleep_ms to 20 to speed up the loop
- C) Add a fourth series to give the chart more work
- D) Call ui.poll() twice per round
Solution
A — set_next() and .value() do not wake the cross-core channel’s 5 ms fast mode, so the screen falls back to the 200 ms mode, draining only 80 commands a second. A text-writing command wakes fast mode for another 500 ms, and the firmware does not redraw unchanged text. Speeding up the loop instead just overflows the queue and drops commands.
-
The right-hand table shows only two and a half rows, with the Z row missing below the edge, and no error. What is the real cause? (choose one · objective 4)
- A) The column is narrower than the text, so it wraps, and every row’s height doubles as a result
- B) ui.Table can only take three rows
- C) add_row was called before col_width
- D) The Thai font in the table is not yet supported
Solution
A — If a column is too narrow, the text wraps onto a new line, and every row’s height instantly doubles. Fix it by widening .col_width() until no cell wraps. This symptom is only visible from the on-screen picture.
-
At PERIOD_MS = 200, you shake the board very fast, but the chart shows a strange slow wave instead. Which explanation is correct? (choose one · objective 4)
- A) It is aliasing, because sampling at 5 Hz can only handle up to 2.5 Hz — this is not a bug, just record it
- B) The sensor is broken; you need a new board
- C) int() was forgotten, so the value rounded until the wave slowed
- D) The table overwrites the chart every second
Solution
A — A 200 ms sample period is 5 samples a second. Shaking faster than half of that rate does not simply disappear — it becomes a frequency on the chart that never really existed, and that cannot be filtered out afterward.
MVP checkpoint. Lessons 3.4–3.6 are passed when every item below is true.
- The screen has one chart with three clearly distinct coloured lines (X blue, Y purple, Z sea-green)
- The board lies still, Z sits near 9–10, X and Y sit near zero
- Shaking the board makes all three lines respond immediately, and the ripple shifts to the left
- The right-hand table shows all four rows, no cell wraps, and the Z row does not disappear below the edge
- Shaking moves the maximum value in the table up and it does not drop back down on its own, while the latest value follows the current number
- The numbers in the table change once per second, while the chart line moves five times a second (stare for ten seconds and count)
- Pressing stop, then shaking hard, makes the chart not move at all, the lamp dims (not vanishes), and the label changes to “stopped”
- Pressing start resumes the chart, the extremes reset back to a dash, and it can toggle back and forth at least three times
- There is an on-screen label reporting the real loop period in milliseconds; record the value and the reason that explains it in your learning log
- It runs continuously for 3 minutes with no hang and no error
Item 7 is the heart of it: a button that changes the lamp while the data keeps moving is a button that is not actually working.
Going further
Section titled “Going further”Keep this file well — lessons 3.7–3.9 will open it up again and extend it into a four-card dashboard, not start over.
If you want to go further, pick one item: feed four kinds of waves into the chart without a sensor and compare against what Nyquist predicts ·
change to int(ax * 100) with a range of -2000 to 2000 and compare the detail · try PERIOD_MS at 500, 200,
100, 50 and 20, both with and without lbl.text() · add a fourth series from dsp.EMA(alpha=0.2) laid over the raw line
Next lesson: Lesson 3.7 — HMI design: cards, visual order, colour and the widget budget
Reflect
Section titled “Reflect”- If you had to send this data to the cloud in lessons 4.4–4.6, would you send every point at 5 Hz, or only when something interesting happens, and what value should be summarised before sending?
- If the network drops for three minutes, should that data simply disappear, or should it be kept?
- Which symptom in the trap table have you actually met, and what on screen told you?
Review questions
Answer on your own first, then open the answer.
-
The chart was created with ui.Chart(..., color=COL_AX) and add_series was called twice for Y and Z. How do you feed the X axis? (Objective 1)
- chart.set_next(0, int(ax))
- s_ax = chart.add_series(COL_AX) แล้วเรียก chart.set_next(s_ax, int(ax))
- chart.set_next(0, ax) เพราะกราฟรับทศนิยมได้
- chart.set_next(s_ay, int(ax))
Show answer
Answer: A. chart.set_next(0, int(ax))
เส้นแรกคือ series 0 ที่มากับ Chart เอง (สีจาก color=) ไม่ต้อง add_series ให้มัน ถ้าเพิ่มอีกจะได้สี่เส้น และ set_next() รับเฉพาะจำนวนเต็ม ส่งทศนิยมตรง ๆ จะได้ TypeError
-
Which statements about the stop button in the solution are correct? Choose all that apply. (Objective 2)
- ui.poll() ถูกเรียกทุกรอบ แม้ running จะเป็น False
- led_rec.value(0) ทำให้ไฟหรี่ลง ไม่ใช่หายไปจากจอ
- กดหยุดแล้วลูป while จบด้วย break
- time.sleep_ms(PERIOD_MS) ยังหน่วงเท่าเดิมตอนหยุดบันทึก
- ค่าสุดขีดในตารางถูกล้างตอนกดหยุด
Show answer
Answer: A. ui.poll() ถูกเรียกทุกรอบ แม้ running จะเป็น False · B. led_rec.value(0) ทำให้ไฟหรี่ลง ไม่ใช่หายไปจากจอ · D. time.sleep_ms(PERIOD_MS) ยังหน่วงเท่าเดิมตอนหยุดบันทึก
หยุดคือ flag ไม่ใช่หยุดลูป poll ต้องอยู่นอก if running ไม่งั้นปุ่มเริ่มจะกดไม่ได้อีก ลูปยังหน่วงเท่าเดิมเพื่อไม่ให้ยิงคำสั่ง poll ใส่ CM55 ถี่ยิบ ส่วนค่าสุดขีดถูกล้างตอนกดเริ่มรอบใหม่ ไม่ใช่ตอนหยุด
-
Your loop sleeps 200 ms and only calls set_next() three times and led.value(), yet the chart crawls and stutters. What is the fix? (Objective 3)
- ส่ง .text() ให้ Label อย่างน้อยหนึ่งครั้งต่อรอบ ส่งข้อความเดิมก็ได้
- ลด sleep_ms เหลือ 20 ให้ลูปเร็วขึ้น
- เพิ่ม series ที่สี่ให้กราฟมีงานมากขึ้น
- เรียก ui.poll() สองครั้งต่อรอบ
Show answer
Answer: A. ส่ง .text() ให้ Label อย่างน้อยหนึ่งครั้งต่อรอบ ส่งข้อความเดิมก็ได้
set_next() กับ .value() ไม่ปลุกโหมดเร็ว 5 ms ของช่องทางข้ามคอร์ จอจึงถอยไปโหมด 200 ms ที่ระบายได้แค่ 80 คำสั่งต่อวินาที คำสั่งเขียนข้อความปลุกโหมดเร็วต่ออีก 500 ms และเฟิร์มแวร์ไม่วาดซ้ำถ้าข้อความเดิม ส่วนการเร่งลูปทำให้คำสั่งล้นคิวแล้วถูกทิ้ง
-
The table shows only two and a half rows, the Z row disappears below the edge, and there is no error. What is the real cause? (Objective 4)
- คอลัมน์แคบกว่าข้อความ ข้อความตกบรรทัด ทุกแถวจึงสูงเป็นสองเท่า
- ui.Table รับได้แค่สามแถว
- เรียก add_row ก่อน col_width
- ฟอนต์ไทยในตารางยังไม่รองรับ
Show answer
Answer: A. คอลัมน์แคบกว่าข้อความ ข้อความตกบรรทัด ทุกแถวจึงสูงเป็นสองเท่า
ถ้าคอลัมน์แคบไป ข้อความจะขึ้นบรรทัดใหม่ แล้วความสูงของทุกแถวเด้งเป็นสองเท่าทันที แก้โดยขยาย .col_width() จนไม่มีช่องไหนตกบรรทัด อาการนี้เห็นได้จากภาพบนจอเท่านั้น
-
With PERIOD_MS = 200 you shake the board very fast, but the chart shows a strange slow wave. Which explanation is correct? (Objective 4)
- เป็น aliasing เพราะสุ่ม 5 Hz รับได้ไม่เกิน 2.5 Hz ไม่ใช่บั๊ก ให้บันทึกไว้
- เซนเซอร์เสีย ต้องเปลี่ยนบอร์ด
- ลืม int() ค่าจึงถูกปัดจนคลื่นช้าลง
- ตารางเขียนทับกราฟทุกวินาที
Show answer
Answer: A. เป็น aliasing เพราะสุ่ม 5 Hz รับได้ไม่เกิน 2.5 Hz ไม่ใช่บั๊ก ให้บันทึกไว้
คาบการสุ่ม 200 ms คือ 5 ตัวอย่างต่อวินาที การสั่นที่เร็วกว่าครึ่งหนึ่งของอัตรานี้ไม่ได้หายไปเฉย ๆ แต่กลายเป็นความถี่ที่ไม่เคยมีอยู่จริงบนกราฟ ซึ่งกรองทิ้งทีหลังไม่ได้
Cite this lesson
If you teach from this lesson or reuse it in slides or documents, credit it with the text below. If you changed it, add (adapted) after the title.
"Hands-on: a three-axis acceleration chart" from TESA Open Knowledge by the Thai Embedded Systems Association (TESA), https://github.com/tesaiot/tesa-qualification-program, licensed under CC BY-NC 4.0
Thai attribution: "ลงมือทำ: กราฟความเร่งสามแกน" จาก TESA Open Knowledge โดยสมาคมสมองกลฝังตัวไทย (Thai Embedded Systems Association: TESA) https://github.com/tesaiot/tesa-qualification-program สัญญาอนุญาต CC BY-NC 4.0
Lesson link: https://tesaiot.github.io/tesa-qualification-program/en/courses/aiot-micropython/m03-sensor-hmi/l06-accel-chart-lab/
This lesson adapts the source below; keep its credit too.
https://github.com/Advance-Innovation-Centre-AIC/embedded-systems-for-aiot-developer/blob/a80bbe88a34bcb9bb8d991f42f9252b77cdab079/session-07.html (slides 33–45)
TESA Open Knowledge · © 2026 สมาคมสมองกลฝังตัวไทย (TESA) · CC BY-NC 4.0
Content is licensed CC BY-NC 4.0. Reuse it non-commercially and credit the Thai Embedded Systems Association (TESA) every time. · How to cite TESA